
A changeover is the work between making one product and making the next one on the same equipment. A line runs cherry soda all morning, someone flushes the old flavoring out of the lines and swaps the label rolls, and by early afternoon that same line is filling bottles of orange soda.
A kitchen does the same thing when it switches from breakfast to lunch. The grill's still there and the cooks are still there, but for a stretch in the middle while they're putting away the pancake batter, scraping down the flat top, and setting out the lunch prep, nobody's getting fed.
These periods where people are working but nothing is being made are worth measuring.
The Clock
Most arguments about changeover time are really arguments about where the clock starts and stops.
The definition that holds up is last good part to first good part. The clock starts on the last acceptable unit of the old product and stops on the first acceptable unit of the new one, coming off at normal running speed.
That definition is deliberately unkind. It picks up the tooling swap, the paperwork, the operator waiting on a fixture that lives in another building, and all of the bottles that come out wrong while the machine is still being adjusted.
For example, a team might report a 40-minute changeover, since the mechanical work takes 40 minutes and that's what somebody stood there and timed. Measured last good part to first good part, the same event runs 95 minutes, and the 55 minutes in between are time spent getting the machine tuned correctly and finding a supervisor to approve the next run.
Both numbers are honest - only one of them says what the changeover actually cost. Changeover time is availability loss, so it lands in the same bucket as a breakdown when the plant calculates OEE.
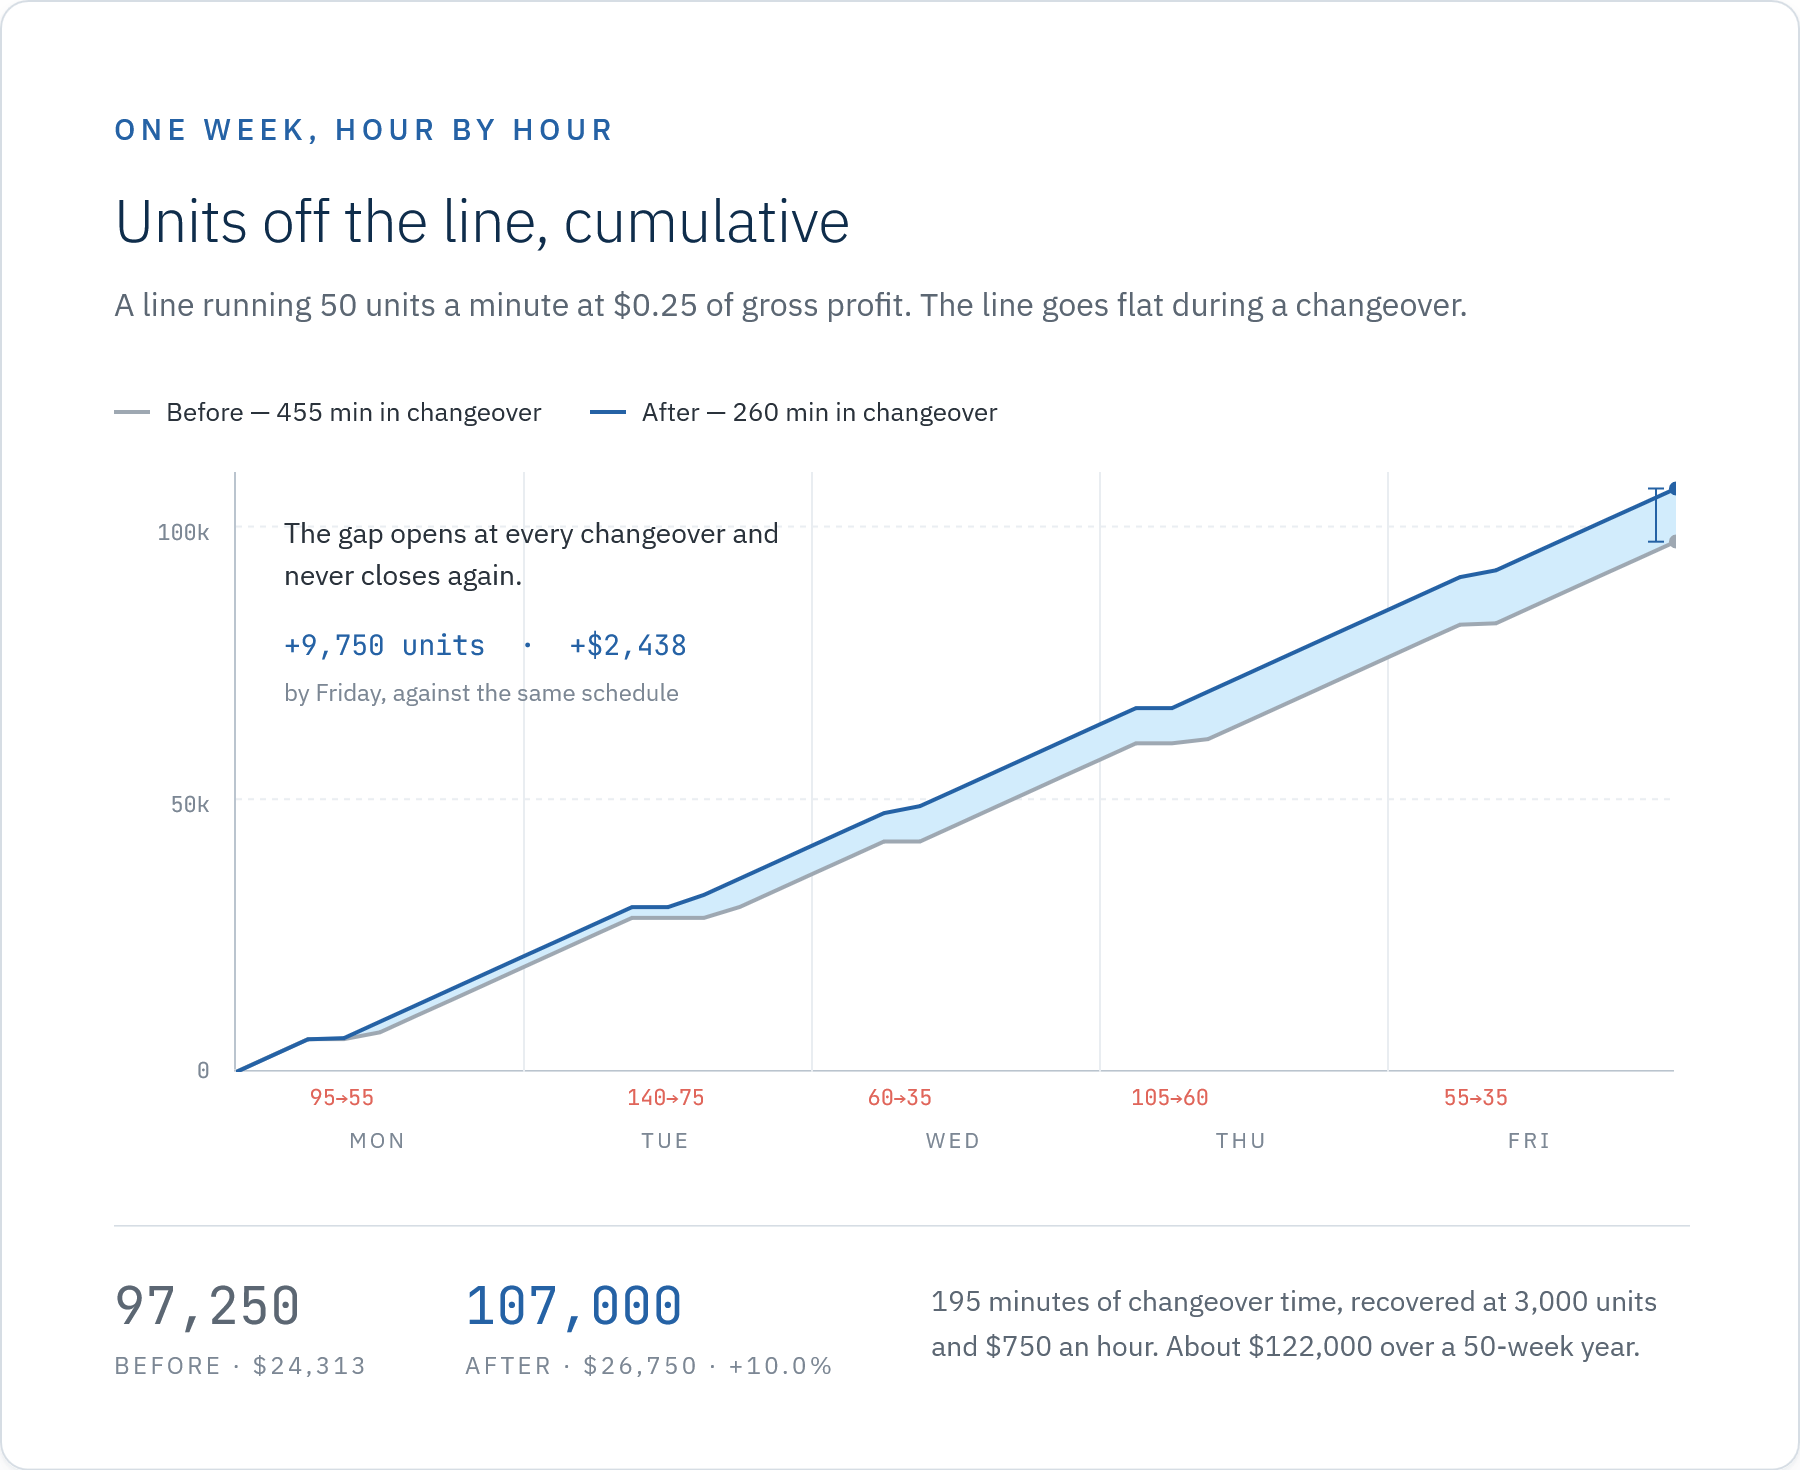
Two Levers
The total cost of changeovers in a month is the number of changeover events that month multiplied by what each event costs. Both halves need a definition before that multiplication means anything.
The count is the straightforward half. It's the number of times a line stopped making one product and started making another, and most plants can pull that number off the production schedule.
The cost of a single event is the production time lost to it, priced at whatever the line earns while it's running. For example, a line that fills 900 bottles an hour at $0.40 of margin per bottle earns $360 an hour, so a 95-minute changeover on that line costs 1,425 bottles and $570 of margin, before counting the flavoring and the label stock that got thrown out.
If that line has spare capacity and can make those 1,425 bottles up later in the week, the real cost is closer to the overtime and the schedule pressure than to the lost margin. On a line that's already sold out, the $570 is money that doesn't come back.
A product of two terms leaves two ways to bring the total down. Run fewer changeovers, or make each changeover shorter, and a serious changeover reduction effort works on both at the same time.
The first is running fewer of them, and that's a scheduling problem more than a shop floor problem. Some transitions are cheap and some are expensive.
Cherry soda to orange soda is cheap, since the bottle, the cap, and the machine settings all stay the same and only the flavoring and the labels change. Cherry soda in a 12 oz can to orange soda in a 2 L bottle is expensive, since nearly every part of the line has to come apart and go back together differently.
If the schedule groups the cheap transitions together, the plant makes the same mix of products with less lost time.
That said, fewer changeovers usually means longer runs, and longer runs mean finished goods sitting in a warehouse waiting on an order that hasn't shown up yet - the plant gets a better changeover number and a worse answer for the customer who wanted 200 units next week.
The second lever is making each changeover shorter, and the standard method for that is called SMED (single-minute exchange of dies). SMED splits the work into internal/external buckets. Internal work can only happen with the line stopped, external work can happen while the line's still running, and the goal is to move as much as possible into the external bucket.
Staging tooling on a cart, pre-kitting the label stock, filling out the paperwork early, etc. In short, the fastest changeover is the one where most of the work already happened.
Paper Logs
Most plants still measure changeovers by hand. An operator writes a start and a stop time on a shift report, a supervisor keys those into a spreadsheet on Friday, and a monthly average comes out the other end.
Three things go wrong there, and they all push the number in the same direction: (1) times get rounded to the nearest 5 or 15 minutes, since nobody remembers at the end of a shift whether the line came back at 2:07 or 2:15, (2) short changeovers don't feel worth recording and get left off, and (3) the parts nobody counts as changeover, like waiting on material or the slow ramp back up to speed, never make the sheet.
The number that reaches the plant manager is smooth, low, and disconnected from the floor. If that plant then runs a project to shorten its changeovers, the before and the after are measured with the same soft ruler, so the improvement is whatever the paperwork says it is.
Consistent Measurement
Both levers depend on measuring the same thing the same way every time. A changeover timed one way on days and another way on nights can't be compared against itself, and two lines running the same job can't be compared against each other.
There's a practical problem sitting underneath that. The person best placed to record the time is the operator, and that operator is busy running the changeover, so the times tend to get written down afterward from memory.
A measurement that depends on somebody with their hands full noting the minute the last good part came off is never going to be consistent, and consistency is the entire point.
At Oscillas, we've developed a set of tools called Artemis OnSite built specifically for this purpose. Sensors on the line see the last good part and the first good part, so the duration comes out of the machine's own behavior and gets calculated the same way on every line, every shift, and every product.
Operators still tag the reason in the downtime log, and that's the part worth keeping human. The system already has the duration, so the person on the floor isn't asked for times, only for the category (changeover, mechanical, material).
Since every event gets stored on its own, you get a distribution instead of an average. A line might show a median changeover of 52 minutes against a 90th percentile of 141 minutes, and that spread of 89 minutes is usually where the schedule actually breaks. The median is an ordinary Tuesday, and the tail is the day that eats a shift.
The from/to product pair gets recorded too, so the changeover matrix builds itself out of real history instead of estimates, which is what the sequencing work runs on.
A SMED project measured this way also has a baseline that survives scrutiny. Before and after come from the same sensors under the same definition, nights and weekends included, so the improvement appears in the data whether or not anyone was standing on the floor with a stopwatch.
If getting a real number for your own changeovers is worth thirty minutes, we'd be glad to walk through what that would look like on your lines. You can book time with us on our contact page.