
OEE helps you understand how you did compared to what was possible. It is one number, built from three.
Most plants measure output. A line made 15,000 units today. That tells you what happened. It does not tell you what could have happened, or what got in the way.
OEE (Overall Equipment Effectiveness) answers the second question. Think of a four-hour shift running delivery orders:
- You sat in a parking lot for forty minutes because no orders came in. → Availability
- Traffic was bad, so you finished six drops an hour instead of eight. → Performance
- One order arrived cold and got refunded. You drove it, you paid for the gas, and you got nothing. → Quality
You were on shift for the whole four hours. Only part of that turned into deliveries you were paid for. Nothing broke, and no single mistake caused it — three ordinary things each took a piece. Each part of OEE measures one of those kinds of loss. Together, they show you where the time went.
The three parts
Availability — was the line running?
Start with the time you planned to run. Subtract the stops you did not plan: a breakdown, a changeover that ran long, a missing pallet of cartons. What is left is run time.
Availability = Run Time ÷ Planned Production Time
Performance — was it running at full speed?
Every line has a design rate. Real lines run slower. A jam, a worn part, an operator who has to feed by hand — each one costs a few seconds. Those seconds add up.
Performance = Actual Output ÷ (Run Time × Ideal Rate)
Quality — was the product good?
A unit that fails inspection used the same minutes, labor, and material as a good one. You just cannot sell it.
Quality = Good Units ÷ Total Units Made
Work an example
One 8-hour shift on a filling line rated at 60 units per minute:
- The shift is 480 minutes. Breaks take 30 of them. Planned production time: 450 minutes.
- Unplanned stops take 45 minutes. Run time: 405 minutes. Availability = 405 ÷ 450 = 90.0%.
- In 405 minutes at 60 per minute, the line could make 24,300 units. It makes 20,655. Performance = 20,655 ÷ 24,300 = 85.0%.
- Of those 20,655 units, 826 cannot be shipped. Good units: 19,829. Quality = 19,829 ÷ 20,655 = 96.0%.
Multiply the three: 0.900 × 0.850 × 0.960 = 73.4%
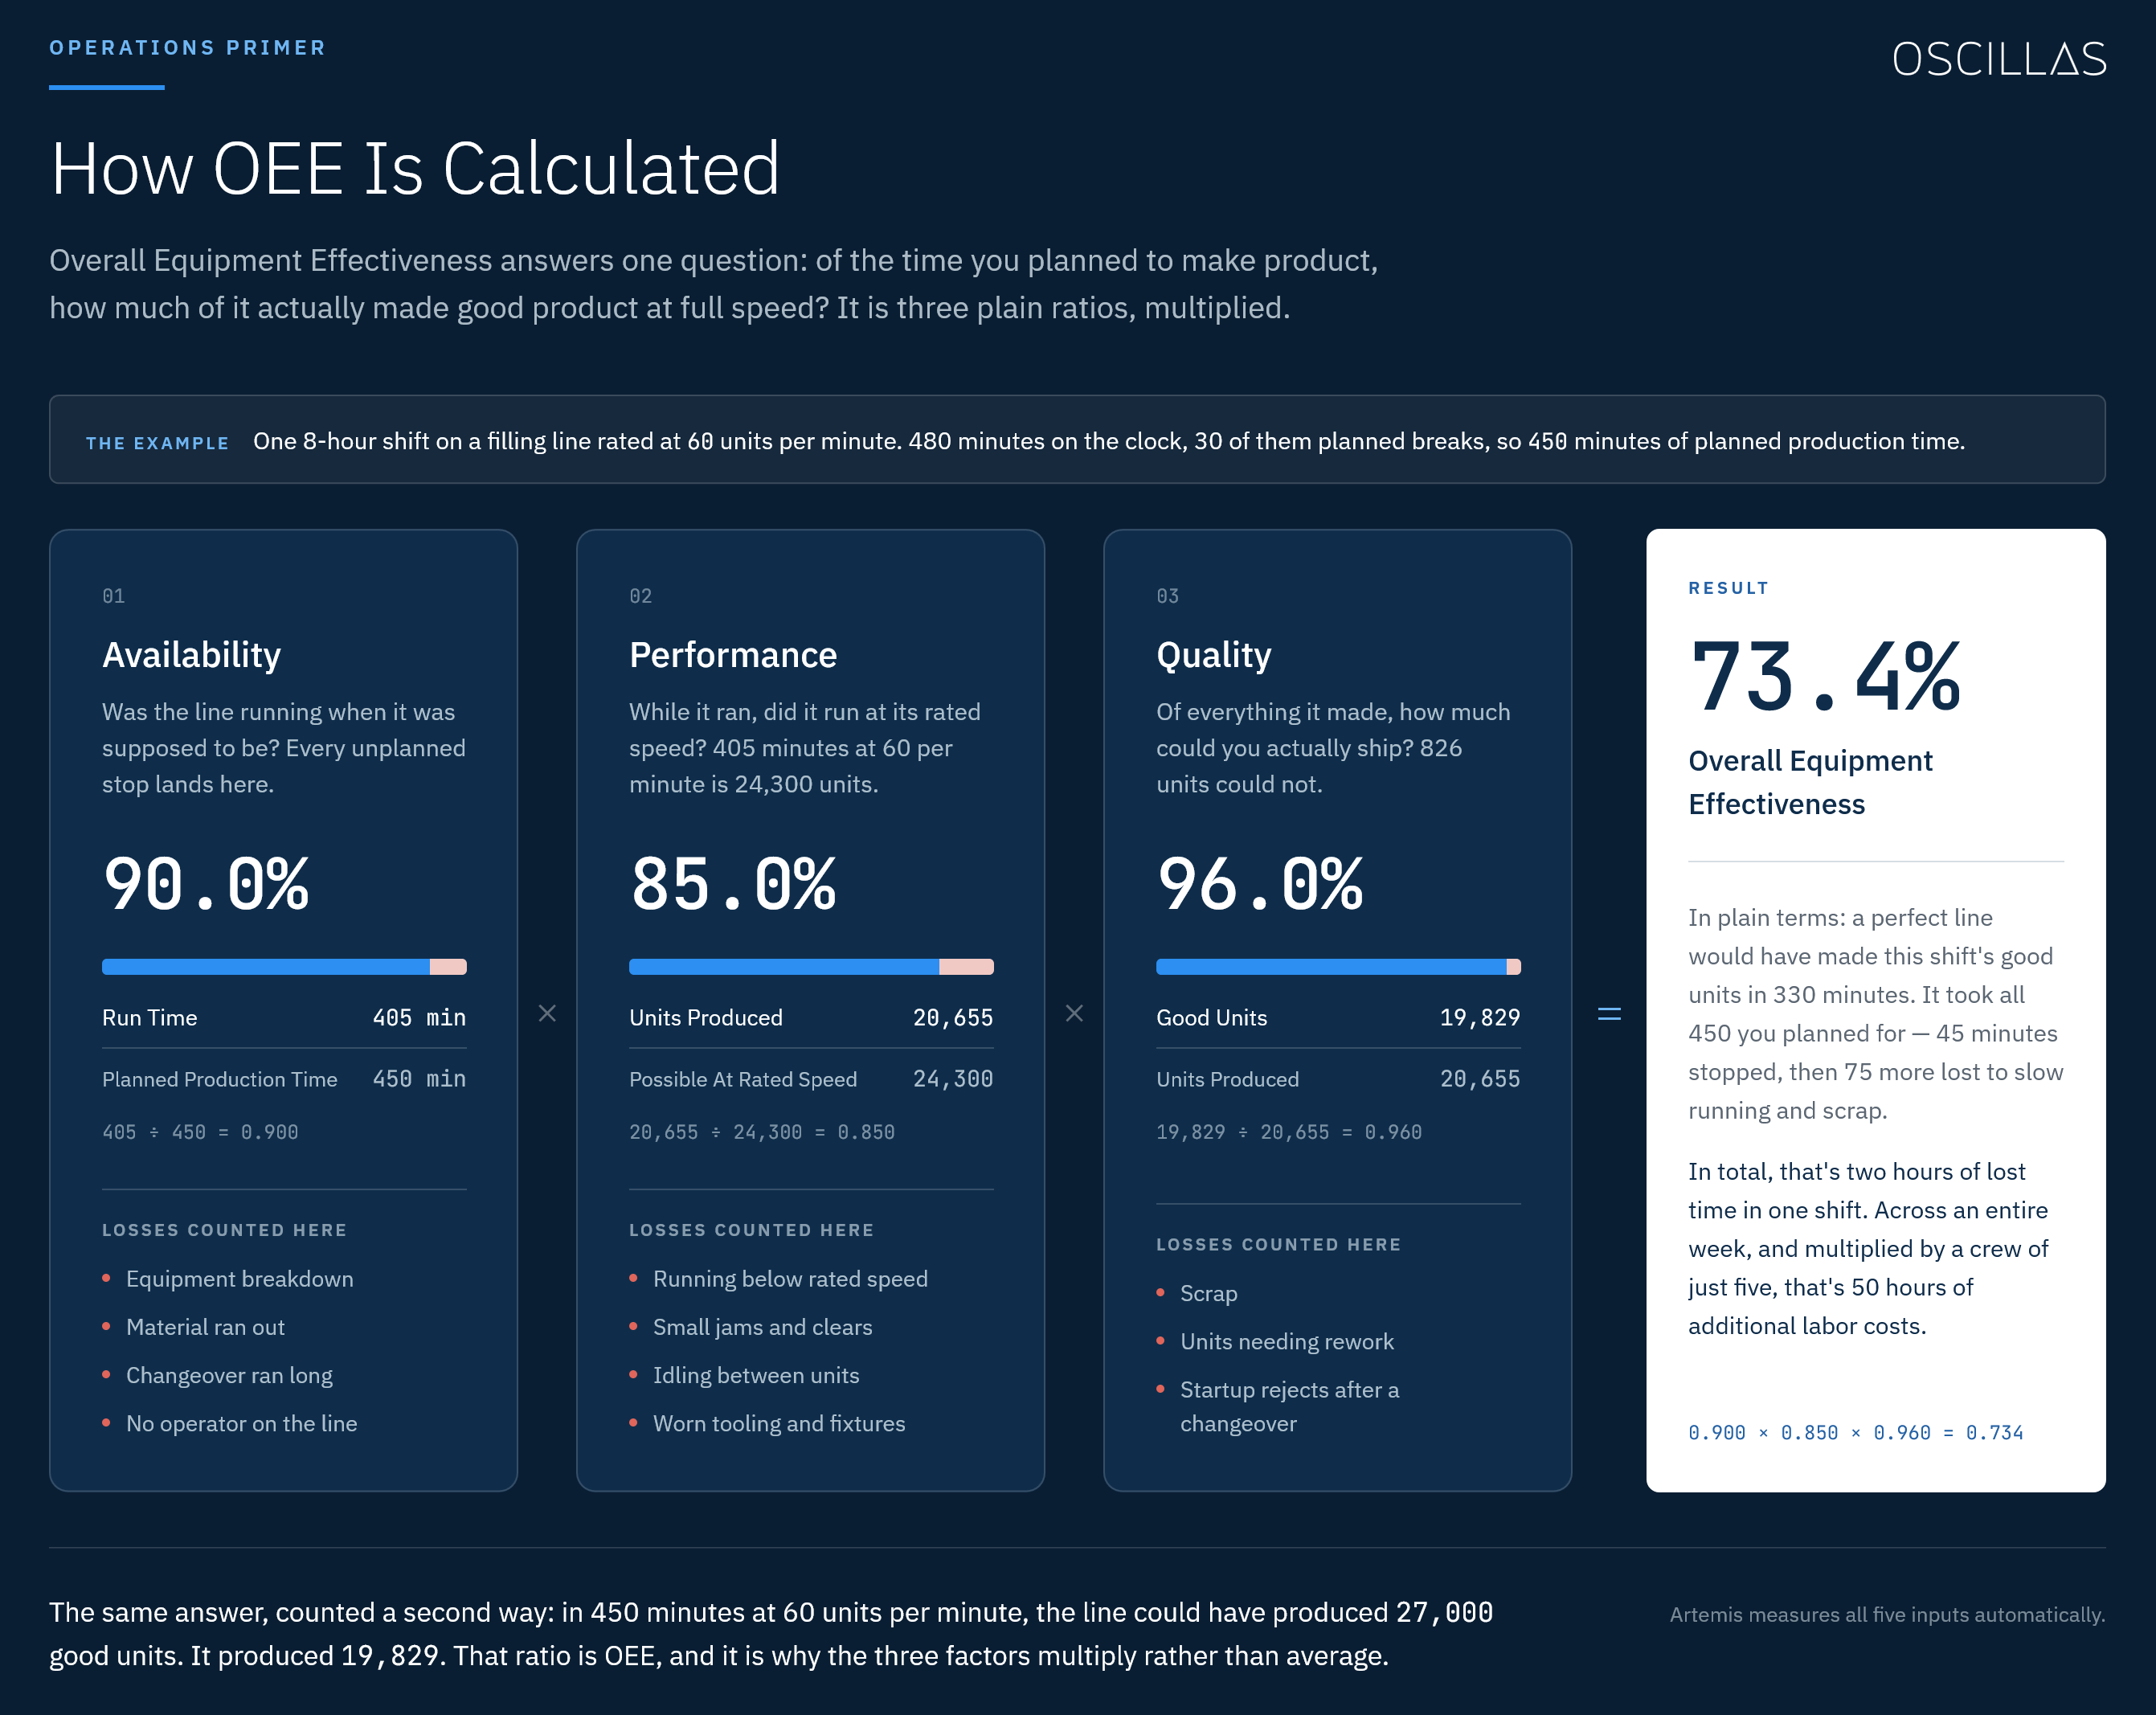
There is a second way to reach the same answer. In 450 minutes at 60 units per minute, the line could have produced 27,000 good units. It produced 19,829. That ratio is OEE. It is also why the three factors multiply instead of averaging — each one takes its cut of the same 27,000.
Why the number surprises people
Nothing in that example was a disaster. On their own, 90, 85, and 96 all sound acceptable. Multiplied, they leave 73.4%.
Put that back into minutes. A perfect line would have made this shift's good units in 330 minutes. It took all 450 you planned for. Forty-five of those minutes the line sat stopped. The other 75 went to slow running and scrap — no alarm, no line in a log, just product that never got made or never got shipped.
That is two hours of lost time in one shift. Run five shifts a week with a crew of five, and you are paying for 50 labor hours that produced nothing you can ship.
That is the useful part of OEE. Small losses in three separate places compound into one large loss. A supervisor watching only the scrap bin would never see it.
What counts as a good number?
The figures people quote: 85% is world-class for a discrete line, 60% is common, and plants that have never measured OEE often land in the 40s or 50s the first time they do.
Treat those as a rough guide, not a target. OEE is most useful when you compare it to yourself — this line against last month, this shift against the one before it. Between different plants and different processes, "planned time" and "ideal rate" get defined too differently for the comparison to mean much.
Do not chase the number, either. OEE is a thermometer. It tells you something is wrong and roughly where. The fix comes from the three parts underneath it, not from the figure on the wall.
The most common mistake
Most OEE is estimated, not measured.
Stops get written on a clipboard at the end of a shift, from memory. The short stops — the 40-second jams that do the most damage to Performance — never get written down at all. On Monday, someone types the sheet into a spreadsheet. What comes out is a story about last week, and it is usually a kind one.
OEE needs five inputs: planned production time, run time, units produced, good units, and the rated speed of the line. When all five come off the line automatically, the number is a tool. When any one of them comes from memory, the number is a guess with decimal places on it.
Oscillas builds the measurement layer underneath numbers like this one. If you want to see OEE calculated on live production data, book thirty minutes with us.