
Some or all of the production lines in your factory have Artemis OnSite installed on them. Artemis OnSite uses sensors to measure when the line is running, when it's stopped, and how fast the line is moving when it is running.
The sensors tell us how much of each day a line spends up or down, but they don't tell us why a line was down. Production Logs give operators on each line the opportunity to say why the line was down at any point. That way, operators, maintenance personnel, and managers can better understand the most common causes of line stops.
Words to Know
These terms are used throughout Production Logs and across the rest of these articles.
| Term | What it means |
|---|---|
| Factory | One plant. A factory contains many lines. |
| Line | One machine that is monitored on its own. |
| Artemis OnSite | The device on the line that the sensors connect to. |
| Shift | A scheduled block of working hours, such as 9 AM to 5 PM. |
| Session | A line operator starts a Session on a line in order to begin logging downtime reasons. |
| Stop | A period the sensors recorded as the line not running. |
| Reason | The explanation for a stop, chosen from a set list. |
| Annotate | To add a reason to a stop. |
| Microstop | A very short stop — one too short to need a reason. |
| Override | A correction made by a supervisor across a chosen period of time. |
What the Sensors Cannot See
A sensor knows the line stopped. It does not know why.
Every stop looks identical to a sensor. A line could be down for a break, for scheduled maintenance, for a changeover, or any number of other reasons — to a sensor, all it can see is that the line is down.
Production Logs allow us to capture the reason that a line is down. With this information, we can better understand some of the reasons that a line may stop when we don't want it to, and come up with solutions to fix them.
The Production Logs also allow us to capture other information that helps improve production planning, like the number of people working on a line, and the product or material that a line is currently producing.
What You Can See
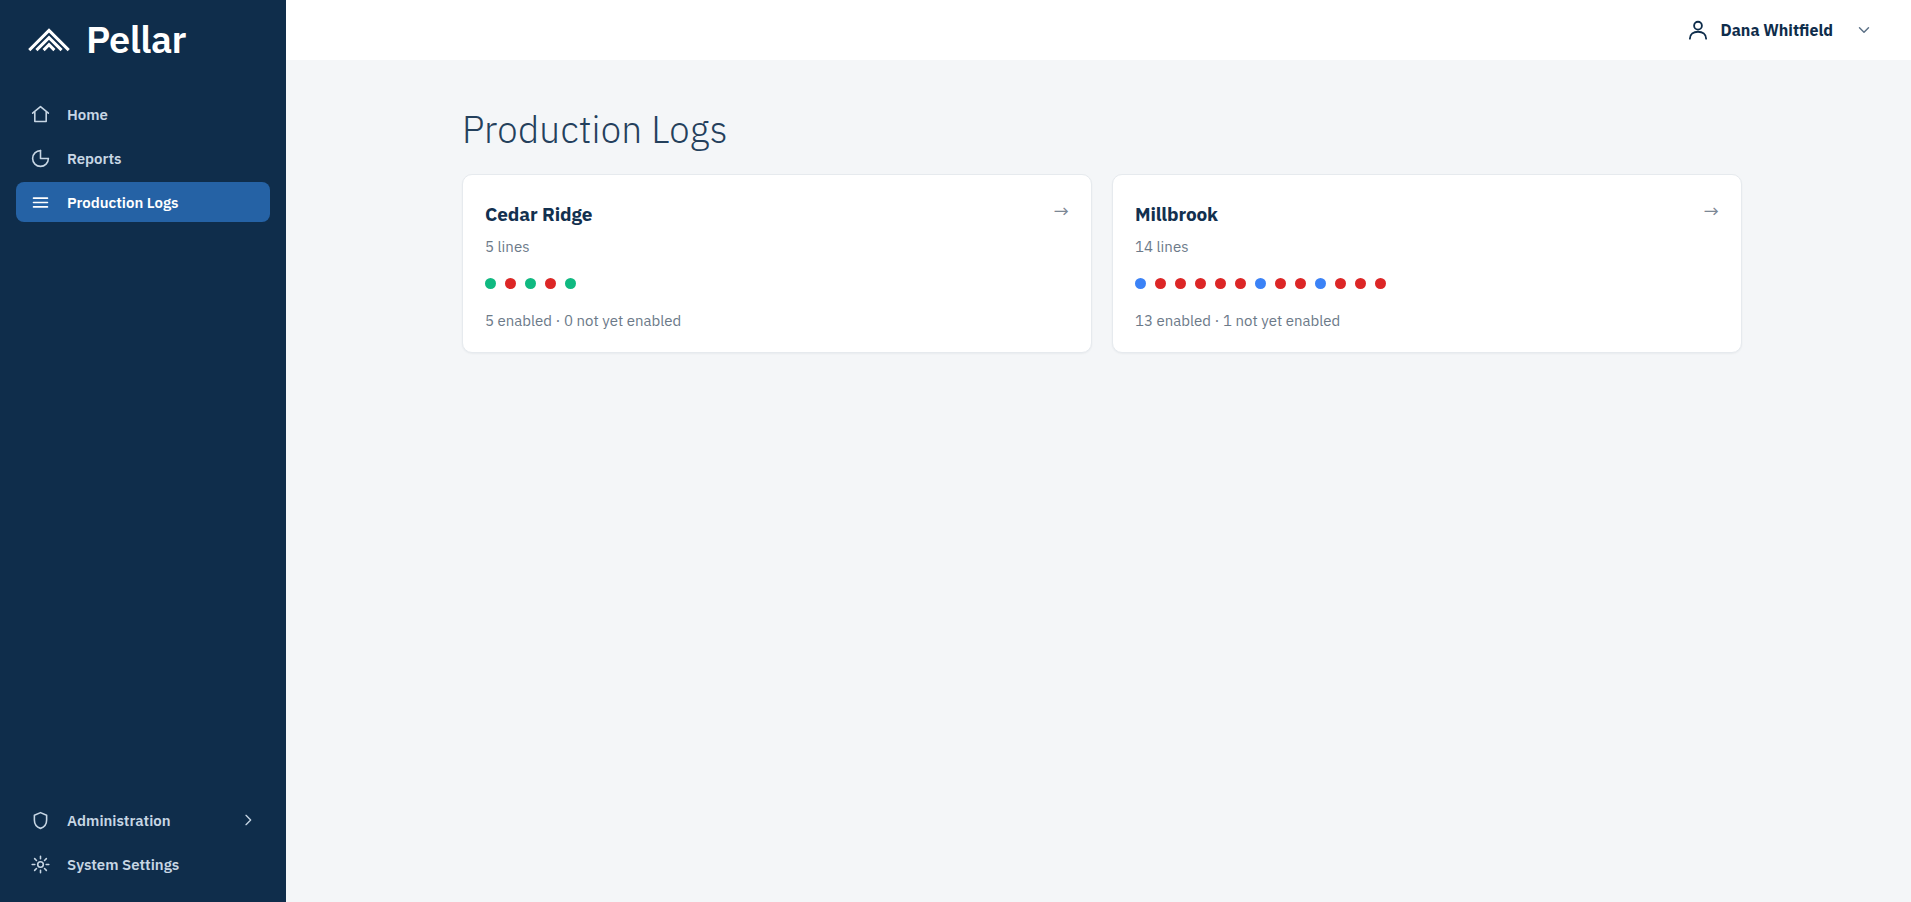
Open Production Logs and you can see a window for the factory you have access to, with a dot for each line so you can tell at a glance what is running right now.
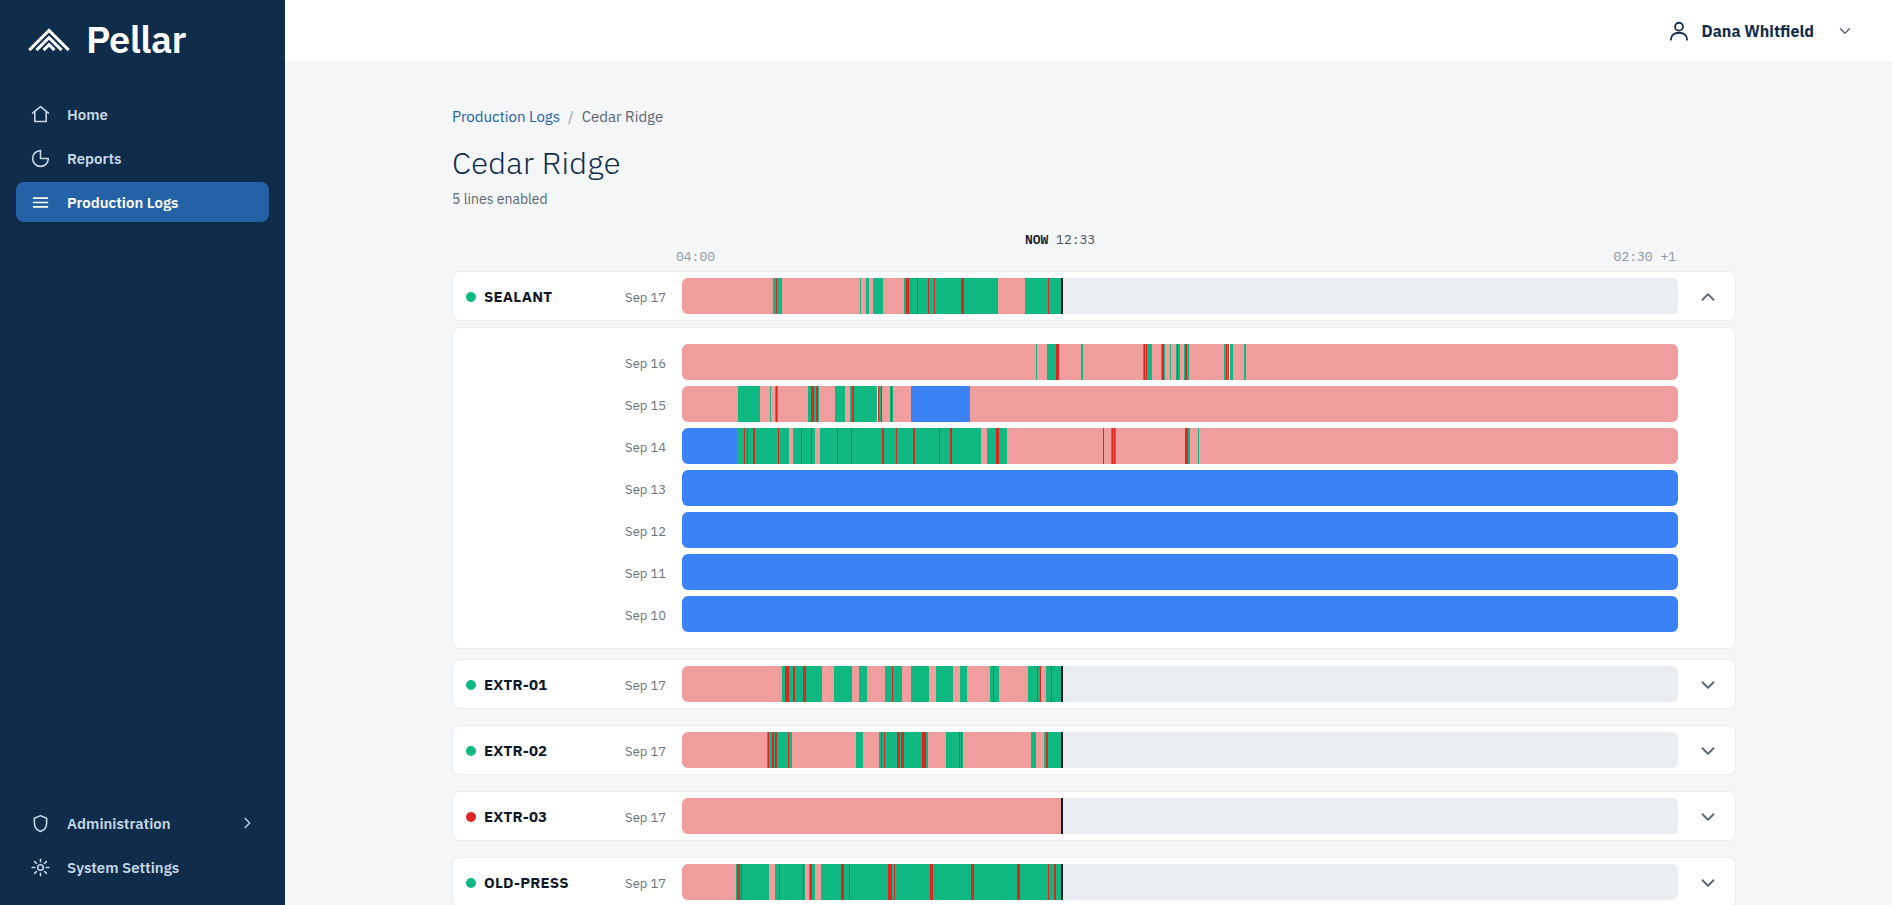
Open a factory and you see every line in it, each with a bar covering the full day. This is the view for scanning the whole floor: which lines are running well, which have long stops sitting on them, and which need attention.
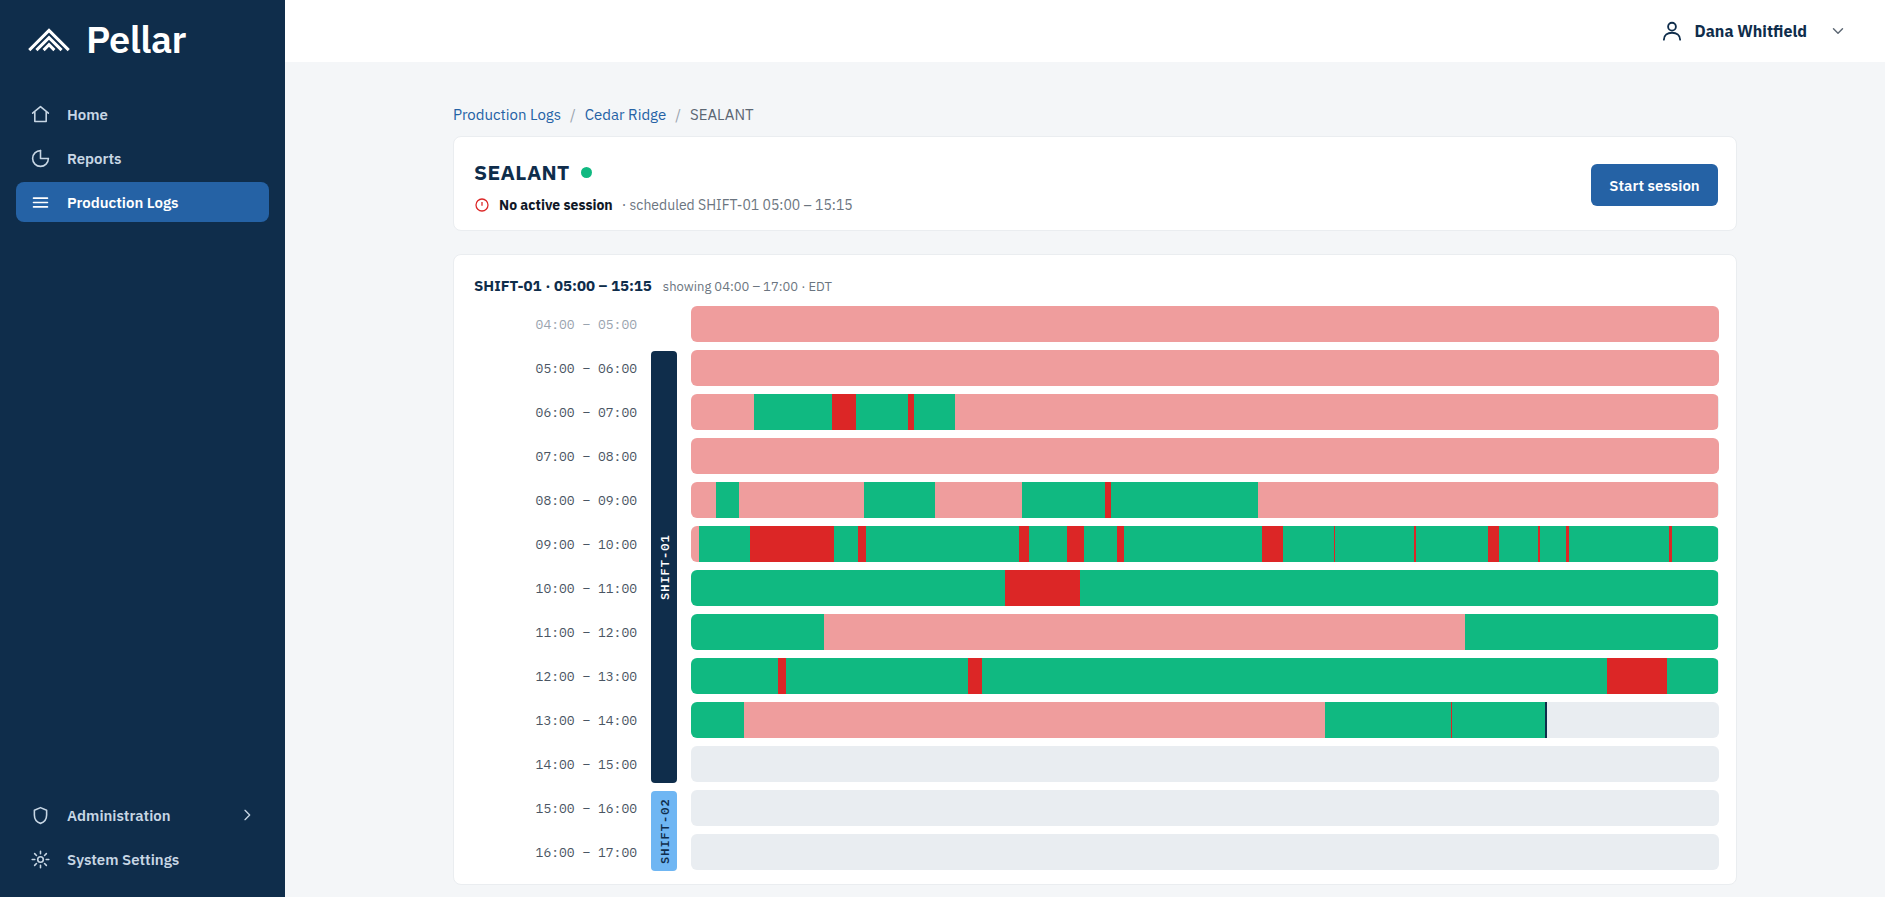
Open a line and you get the detail. The day is broken into rows, one per hour, with the shifts marked down the side. You can also look back over the previous week to see whether a problem is new or whether it happens every day.
Reading the Colors
| Color | What it means |
|---|---|
| Green | The line is running. |
| Blue | The line is down for a planned reason (not scheduled, planned maintenance, etc.). |
| Red | The line is down, and someone has provided a reason in the Production Log. |
| Light red | The line is down, and the Production Log still needs a reason. |
Light red is the color that asks for something. It marks a stop the sensors caught but cannot explain, such as maintenance, and it stays light red until a person adds the reason.
Where to Go Next
This article covers what Production Logs are and why they're important to improving a factory's operations. The other articles cover using them.
- Basics of Running a Production Log Session — starting and ending a session, recording the material and the headcount, and adding reasons to stops.
- Supervisor Overrides — correcting a whole period of time when the recorded data does not match what happened.
- Adding and Removing an Operator — giving people access, and setting up a shared tablet for operators without a company email.